If you’re using Application Manager to solve your application execution issues (and lets face it, if you’re not, you’re missing out on a “set and forget” way to keep your users from causing themselves problems), sometimes you’ll need to know why a particular executable is being blocked. Sometimes you may find an erroneous configuration can cause more problems than it solves, and when this happens, you’ll need to become familiar with the Rules Analyzer feature.
For the purposes of this article, we’ve configured a XenApp system with a single configuration to block Administrators from executing notepad.exe. In practice, restricting your Administrators is a bad idea, but I’ve set it up this way for the sake of simplicity.
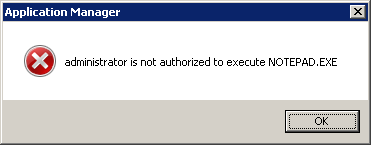
First of all we’ll log on as an administrator and try to run Notepad. Predictably, as Application Manager does what it’s told, we see this
Yes, I know we’re perfectly well aware of the configured rule that made this happen, but let’s just pretend we’re not. How do we go about finding why the application was blocked from execution, what parameters made it get stopped? We’ll need to open the Application Manager console and click on the Rules Analyzer option down towards the bottom left of the screen
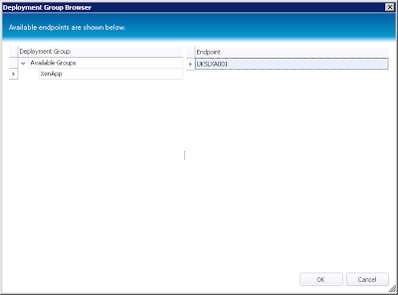
First we need to add a target endpoint. When testing rules in this way, it’s a good idea to configure a single system we can log on to and recreate the issue. We’ve only got the one system here anyway, so we right-click on Endpoints and choose Add Endpoint | Browse Deployment Group. You can browse the domain as well, but this option is usually the easiest, especially if you have a particular target system you want to add
Select your target from the screen and click OK
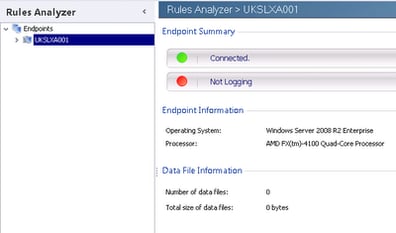
Once this is done, you’ll see your endpoint in the main screen
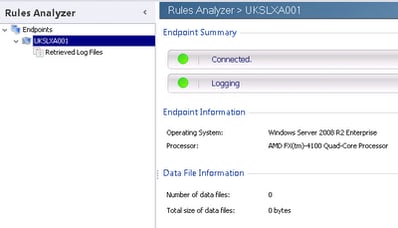
Next we need to start logging. AM logging is pretty intensive (and I’ve seen servers struggle when logging is enabled and there’s a heavy user load), so that’s why its good to a) use a dedicated test server, and b) only enable logging to recreate the issue and then halt it again. To start, we right-click the endpoint and choose Start Logging. You’ll see the logging icon turn green
Now log on as normal to the target endpoint and recreate the issue. Once you’ve seen the blocked message, stop the logging by right-clicking the endpoint and choosing Stop Logging. You’ll get prompted for a report name to save the details to
Choose a name and click Save. The XML file generated will automatically be highlighted on the left-hand side of the console
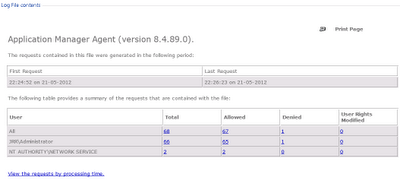
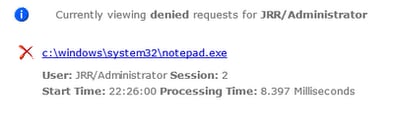
Note the blue links under the requests that were either allowed, denied or modified. These allow you to drill into each instance and see what caused them. Naturally, we’re interested in the single Denied under the user name of Administrator. Most of the time you will be looking at what’s been blocked, but sometimes you may want to find out why something has been allowed. We drill into the Denied request
and then click on the next blue link to find exactly why the application was blocked
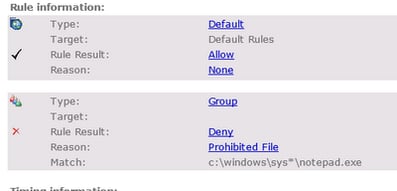
We can see from this it is a Rule that blocked it. The Default rule is processed first which would have allowed it, but then a Group rule denies it with a prohibited file reason. The matching file is shown. Again, we can click on any of the blue links for a little more explanation
So now we know why notepad.exe was blocked. Obviously this is a very simple example, but you will find this feature of Application Manager invaluable when rules don’t work as expected. It simplifies the troubleshooting required when lots of rules with different orders of precedence are in effect and there may be other factors in play such as Trusted Ownership.

